UNNATI N.
  • Home
  • Research
  • CV
  • Blog
  • Videos
  • Contact
  • Personal

Let's Learn Together

Data-driven Marketing for Theory and Practice

TUne in to my PODCAST: How mobile app failures disrupt in-store shopping journeys

5/6/2025

0 Comments

 
Picture
0 Comments

From Inception to Publication: 8 Years in the Making of a Research Paper

1/30/2025

0 Comments

 
PictureMarketing Science Conference 2017
This week, the second essay of my dissertation and my job market paper was accepted for publication at the Journal of Marketing Research. I am grateful to the editors and reviewers, and to my co-authors who continued to show faith in this work and invest their energy into it.
 
I started this project as a second-year student in my PhD in 2016. I loved it from the start. We had all the elements of a good empirical paper – clean and important intervention/shock (i.e., an exogenous mobile app server failure in a large omnichannel retailer’s app), the right data (i.e., cross-channel individual purchases and mobile app usage data), and a rich and fascinating body of research we could speak to (i.e., cross-channel marketing, service failures). Coming from a retail background pretty fresh into my PhD, the prospects excited me. The project was serendipitous and came out of my raw data exploration—plotting mobile app “events” where I started to notice huge spikes in server errors. What excited me even more is that the marketing team of the company providing the data had no idea and we alerted them to this tech/business challenge they later started taking seriously.
 
So, when the paper has finally made it through the review process now in 2025, I feel compelled to share the journey of this paper. In doing so, I am hoping to share some lessons with current and future PhD students on JUST how much seeing a paper through takes. Not just the hours of analysis or writing, but the intangible inner work and growth.
 
The paper is a story, a memory, a vivid reminder of moments that went into its making. When I look at it, I remember myself as a grad student in 2016 on co-author calls trying to figure out the early evidence in the data during holidays and weekends, in town and when traveling. I remember myself presenting this paper as my second-year qualifier for my PhD after a strenuous flight back in the midst of the Hurricane Harvey in 2017 (not to mention when I was struggling in my marriage and on the brink of a divorce). My earliest memories presenting this paper are from the 2017 marketing science conference, where I still remember stalwarts and experts on mobile marketing in the audience.
 
So now that it’s “made it” in the traditional sense, it’s hard not to be emotional. It’s hard also not to be a little numb, if I am honest. It’s been a long journey.
 
It is not often that you receive positive news in academia. And I say this recognizing that I am coming from a place of privilege--from a place of having been able to get my degree at a good school, from being able to immigrate to the U.S., from having had good mentors and a supportive family, from having had the fortune to be a part of a community and environment that creates opportunities, from having had “persistence and grit” as many would say but also the fortune of getting my early work accepted when it could’ve just easily been shot down.
 
But I also say this from a place of working really really hard. And I don’t mean the mechanics of it, of collecting and cleaning data, or of running regressions, or of rewriting hundreds of times, of updating my thinking and conceptualization. I mean the inner work--of finding comfort in discomfort and in creative destruction (i.e., being willing to throw out old ideas that are not working and implement new changes through the process), of putting myself out there—even if it means harsh rejections, of getting personal and distraught when I (or the paper, since I’m told your research is not YOU) am rejected, but then getting back up on my feet to work through the clarity of what needs to be done next.
 
I also say this from a place of managing with care and kindness your co-author and advisor relationships. People before projects. Always. This is a valuable life lesson for me. And I appreciate my co-authors for their patience and encouragement throughout—now that I am an advisor and working with students, I realize how much work it takes even to review the findings and come back to the drawing board several times! I am grateful to them for navigating a messy multi-journal multi-year review process with me.
 
Importantly, I am thankful that this is one of those cases where the paper improved through the review process. The editor, AE, and the reviewers pushed us on the right elements. This is not something I take lightly, having been through brutal and unfair review processes a fair amount.
 
A key lesson I learned with this paper was to evolve with the review process. In the early revisions, we expanded from one failure event to two even though getting the additional data was hard. In the second experience, we dived much deeper into the consumer search process and underlying explanations. The paper is completely different from where it started—and much richer. I always give the example from this paper to students how I have a running document with 125+ figures to explore and visualize the data to fully understand the robust patterns. Even if only 10 make it to the final paper, it’s worth the groundwork. You need the groundwork.
 
So why am I both emotional and numb at the same time now that it’s done? Because by the time projects reach the closure they deserve (which in many cases, they may not at all), it’s natural for a part of your starry-eyed dream, especially if it was your dissertation, job market paper, and one of the first few projects of your life, to die a little. The grit lies in not letting them die. The grit is in getting as excited about the work today as you were when you started. Like I always say, fortunately, I chose topics I truly cared about and was interested in. How miserable would this journey have been otherwise!?
 
Rough timelines across journals from memory of this paper for a “curious” reader
 
Summer 2018 - First submission
Fall 2018 – Reject and resubmit
Summer 2019 –  Second submission (revision)
Fall 2019 – Major revision
Spring 2020 – Third submission (revision)
Fall 2020 – Reject
Summer 2021 - First submission
Fall 2021 – Received Major revision
Fall 2022 – Second submission (revision)
Spring 2023 – Rejected
Fall 2023 - First submission
Fall 2023 – Risky revision
Summer 2024 - Second submission (revision)
Summer 2024 – Revision
Fall 2024 – Third submission
Fall 2024 – Conditional accept
Spring 2024 – Unconditional accept
 
Examples of key review concerns through the various journals and how the paper evolved:


  1. Cross-channel effects seemed interesting to the team, but they did not like the fact that most sales take place offline i.e., that the data came from an offline-dominant multichannel retailer like Walmart, or Macys. We better explained the context and incorporated more data from the online channel along with power calculations.
  2. Did not like the fact that the sample was from holiday periods, e.g., Nov 2014. We collected more data on another failure in April 2018 that became our main sample.
  3. Some journals stated small effect sizes as ground for rejections because it doesn’t matter (it’s 3-7%). Effect size has not changed in 8 years. We better explained the economic effects of app failures and owned up to the short-term nature of effects.
  4. Mechanisms are a hard sell. Our initial mechanisms included brand dilution and a brand damage effect. We moved away from this explanation and dived much deeper into search and channel switching. We added completely new data and new analyses to add theoretical richness to the paper and by exploring different mechanisms empirically.
 
All in all, it is a complet
ely different (and in my biased view, much stronger paper) in 2025. The JMR review team was phenomenal in guiding us and focusing our attention on the most interesting aspects of the paper.

0 Comments

SUMMER 2024: reflections and updates as an assistant professor--advice vs. reality!

5/5/2024

0 Comments

 
Spring 2024 was a semester of many milestones across all domains of my work: research, service, and teaching.

On research, my first-ever-paper with my advisee and PhD student received a revision opportunity. I submitted two other major revisions that I * actually * thought improved the papers, which is not always the case. On service, I was invited to the editorial review boards (ERB) of two journals in marketing, including the Journal of Marketing whose new efficient review process and focus on publishing novel research I admire. I received my first ever reviewing recognition as one of the best reviewers for the Journal of the Academy of Marketing Science. Importantly, as the PhD coordinator (with Rosanna) at Gies, I got to work with PhD students on their goals more closely, including conversations about what it means to get a PhD in marketing right now. On teaching, I mentored MS teams on their mini research projects with me the entire semester that led to some cool findings! This was one of my best marketing analytics cohort since 2020.

Here are some reflections on each area of my work, and how I continued challenging common-wisdom (often even my own beliefs):

Research with PhD students and mentoring: 

Junior faculty are often given the advice to not work with PhD students, at least not as their primary advisor. It takes too much time.

In hindsight, perhaps this advice is prudent. As most things in my life, I serendipitously was matched with a student who wanted to do empirical work the year I joined Gies. I was the only empirical quant person in the group and so, I advised the student's first and second year papers; these are also the critical stages of a PhD when you can potentially get "kicked out" and so, also the time when I needed to have hard conversations with the student (and with the department). While much of the work with students is research-related, a ton of it is also decoding to them what a PhD and academic life mean, and the philosophy of it. Were there moments I wanted to give up? Sure. Was the first rejection on the paper we submitted hard? Always. Were we able to re-work it majorly and get to a revision opportunity? Gratefully, yes. In hindsight, perhaps I had to project-manage much more than I'd have liked or had ever needed my advisors to do for me. Yet, there were some rewarding moments making it worth it.

The biggest lesson I learned is to have the hard conversations and to work with the student's goals and aspirations, and not your goals and aspirations for them -- or how you would've done things if this was your PhD.

As my colleague Maria Rodas and I often discuss, working with PhD students is a service. As a pre-tenure faculty, your work with PhD students likely won't contribute a lot to your tenure. In fact, it may take up more time and effort (and emotional energy) than you can afford. But it's also a responsibility for us to move our field forward and pass on what we have learned.

Caveat: I should say that I have had to cut down mentoring MS students on research ever since my work with the PhD student scaled up. Time and priorities can be managed. I also cut down my travel from November to April, until all my major revisions were sent back in.

​Research and reviewing (and the synergies)
Junior faculty are often given the advice to review selectively, or only review for journals they hope to be on the ERBs of. It takes too much time.

Reviewing makes you a better researcher in my view. Others can perhaps give a ton more reviewing advice on how to write good reviews, but I will share 3 things that have helped me use reviewing feedback as a way to improve my own research and reviews:
  1. Pay attention to the decision letter: The decision letters sent out by the Editor with the AE and review team's feedback can be used to gauge the quality of your review. Ken Wilbur, someone I consider a mentor, once shared with me that the alignment between your recommendation and the editor's decision on a paper should be going up over time. Another good indicator is how often the editor/AE may refer to your comments in their letters, and if they found it useful.
  2. Get direct feedback: Sometimes, I have also reached out to the editors for direct feedback and/or thanked them for the opportunity to review. I recently ALSO had an in-person discussion with an AE I reviewed for. Sometimes you can learn very specific things they liked in your review--which is your cue to keep doing it. Not to pat-myself-on-the-back too much but one editor said: "On this one, you caught a critical confound, and gave them a way out. I appreciate your tendencies to be both constructive and critical, and this is very crucial to the development of papers."
  3. Gain insights on processes and people: Reviewing is a service to others but also a service to yourself. As an author, you could be better informed now about how various editors and/or AE's write their letters and what's important to them. Otherwise, there is a huge information asymmetry especially starting out as a PhD student and junior faculty. Making the review process (and personalities!) transparent helps. I often wonder why reviewer comments and process cannot be published once the papers are out -- as a way for readers to get insight into what the papers went through. In this aspect, I highly recommend the How I wrote this podcast!

Similarly, I learned a lot from giving others feedback on their papers through tangible and intangible ways including discussing my peer and friend's Shrabastee and her co-authors work on Goodreads at UCSD recently (video, paper).

Teaching (and synergies with research and mentoring)
Junior faculty are often given the advice to not to take on too many new preps. It takes too much time.

While I have been lucky to be able to stack my teaching and get an extended 2-0 teaching load (3-0 is more common), I have never shied away from a new prep. I have taught marketing analytics to undergrads (BADM 361), marketing analytics to masters (BADM 591), two different online iMBA courses (that also have a Coursera version with over 67k learners here and here), and an advanced marketing management course to undergrads (BADM 420) that earned me the Poets&Quants' Best Undergrad Professor honor.

Again, others can offer much more teaching advice and great content (e.g., I often refer to Ken and Dan's course materials here and Avi's quant marketing PhD seminar list here among others), I want to emphasize synergies between research and teaching that have helped me:
  1. Make your research known to students: In my marketing analytics course, I discuss causal and predictive models. I often devote time during class to share my (and others') research with my students and allow them to apply class concepts to the research topics. For example, I discussed Brand, Ayelet et al.'s new GPT work in my iMBA session on sources of data. Ayelet was gracious enough to share her slides with me! Similarly, I discussed political consumerism research and retailing research. I even invited Nathan to my class to speak to the students and he graciously agreed to do this.
  2. Make your class topical and current: If I read an interesting paper or attend an interesting seminar in a particular week, I bring it to my students. Last month at the Haring Symposium, PK made an excellent presentation on technology's role in marketing. He had several cases on AI and influencer marketing, which were topics I was also covering in my course. Some of my MS students in their course project were studying ChatGPT's impact on youtube content. Again, PK was gracious enough to let me use some of his slides and the students loved examples he had on TikTok's role in product development, e.g., in case of Chipotle creating a Philly Cheesesteak quesadilla.
  3. Raise the bar for your students: My last reflection from my teaching this semester is that we need to ask more of our students and to show them how much more they can accomplish compared to what they think they can do. When they say "I can't do it" there is a way to break it down into small chunks of tasks and ask them to get interim feedback from you or their peers to make the bigger goals less overwhelming and more attainable.

Finally, across all domains, it's helped me to SHOW UP to things, be part of a community, and help propel others as you have been helped along the way. 

​Coming soon: Next week, I will post about the exciting projects my MS students put together this semester including framing questions about collecting data to analyze topics like  how do Boeing crashes impact its stock prices and order cancellations, and how Taylor Swift's appearances in NFL games impacts the social media following of Travis Kelce and related influencers. More soon!​
0 Comments

HOw do store closures impact sales? My interview @ Illinois news gazette

2/29/2024

0 Comments

 
Picture
0 Comments

Joining as vp of outreach @ ama rapsig

1/7/2024

0 Comments

 
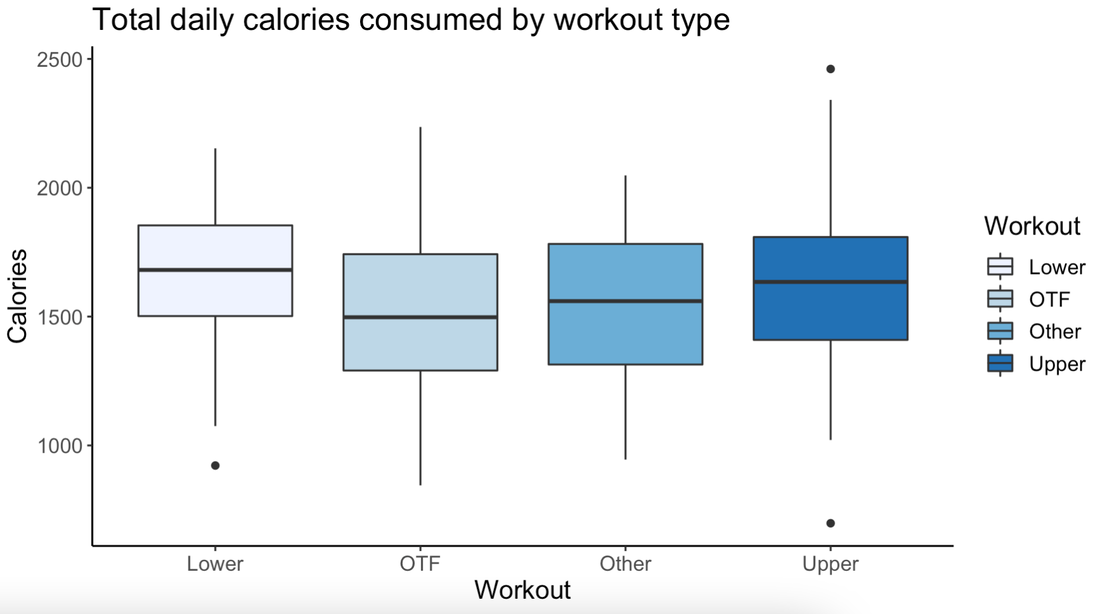
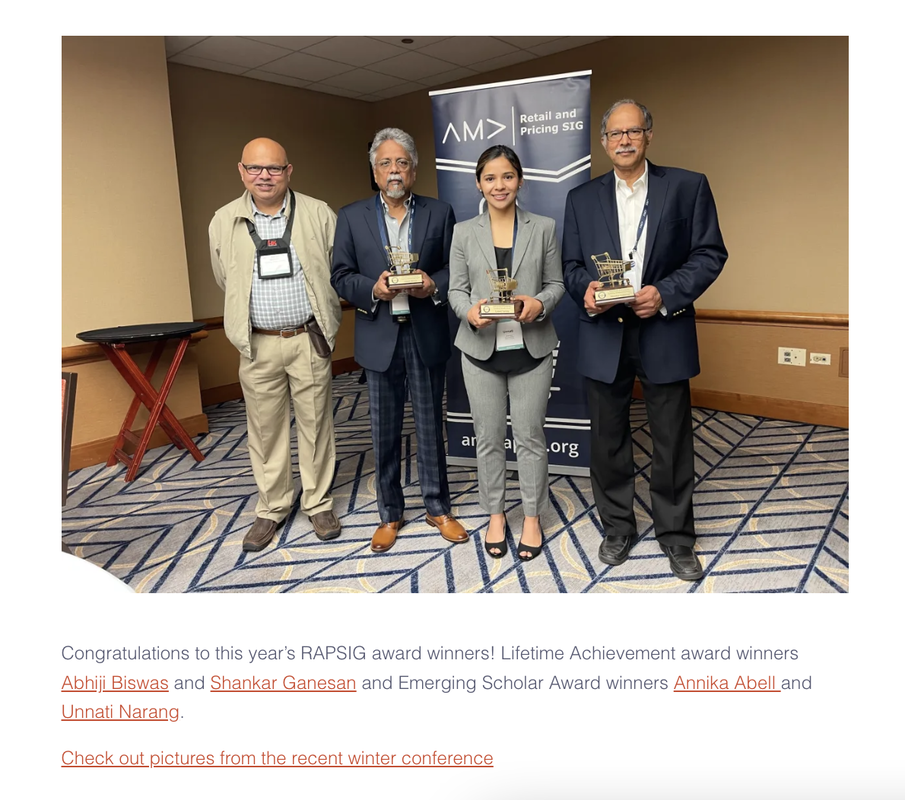
The American Marketing Association's (AMA) Retail & Pricing Special Interest Group (RAPSIG) interviewed me about my research and teaching, as their incoming Vice President of Outreach. Read more here: amarapsig.org/?page_id=2324.
Picture
0 Comments

2023 - My Year in Numbers

12/26/2023

0 Comments

 
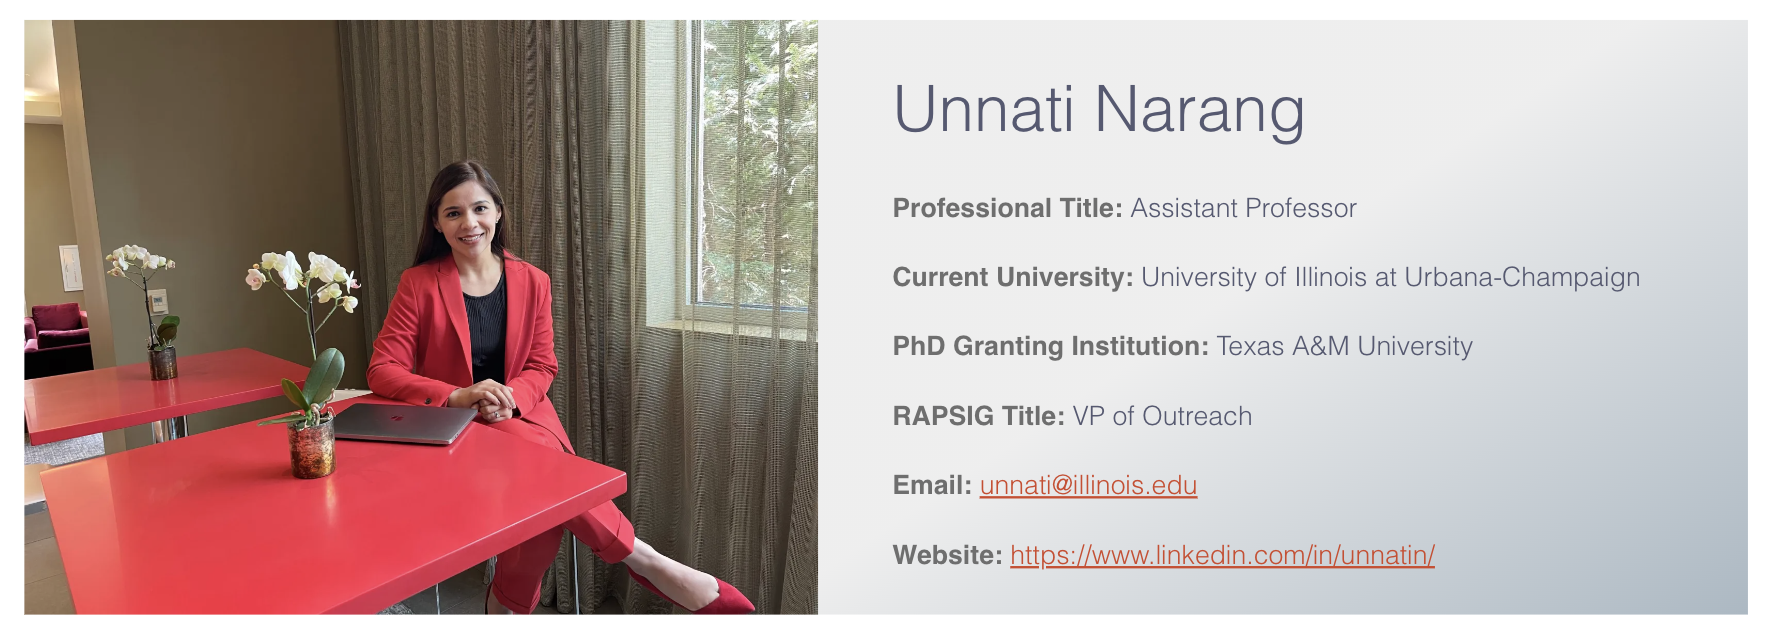
For the last two years, I have been tracking and sharing my data in these blog posts for 2022 and 2021. This year, I continued the tradition.

I primarily track two types of data: Work (e.g., hours logged on research, reviewing, teaching) and health (e.g., daily workouts, calories consumed).
 
Recap: In both 2021 and 2022, I spent ~900 hours working on my top 5-6 research projects based on reports generated by an app called Toggl. Of course, all this is based on the projects and hours I am able to track in Toggl subject to some measurement error. 
I completed over 250 hours of workouts each year, dropping 20+ lbs in 2021 then maintaining in 2022.

How does 2023 look?
@ work: This year, I exceeded my research input of the last two years. I submitted 6 new/revised submissions (relative to 4ish last two years), including a manuscript with a PhD student and a solo-authored paper. I spent 1,000+ hours on my top 4 projects with over 70% of that on one paper (phew!). 

I spent fewer hours on exploring new ideas than I have in the past -- mostly doing so in the Spring semester (no teaching). Unlike last few years, when I had to kill many new ideas, I was able to see this one through -- and moved it into a "real" project bucket to become my 2nd biggest project investment this year. 

Importantly, I noticed that my hours spent on reviewing/writing referee reports doubled compared to last year. That must be a good thing, right? I don't usually report this but will be fun to track over the long-term....

@ the gym: I  increased my focus on weightlifting and was able to achieve new PRs of 200 and 300 lbs on squats and hip thrusts in June (!!) despite several health challenges throughout the year. I incorporated more yoga (although steady state cardio and HIIT both took a hit this year for me). Yoga has been a lovely addition to my life -- and I will not attempt to capture its impact in numbers. 

--


As always, quality over quantity; so I cannot end this post without mentioning some of the opportunities for growth this year that are not captured by the data. Many in-depth conversations with peers and colleagues, opportunities to visit other groups (Reichman and Tel Aviv University in Israel, Washington University in St. Louis, Michigan Ross, and INSEAD in France as well as conferences @ UT-Dallas and Temple), and to continue to push past many rejections and risky revisions. Other highlights of the year include my interactions with students, co-chairing our PhD committee, organizing mental health workshops for students, and being part of their convocation experience esp. for the iMBA graduates.

--

More stats and how I track my data below:

Picture
Picture
Picture
Picture
Picture
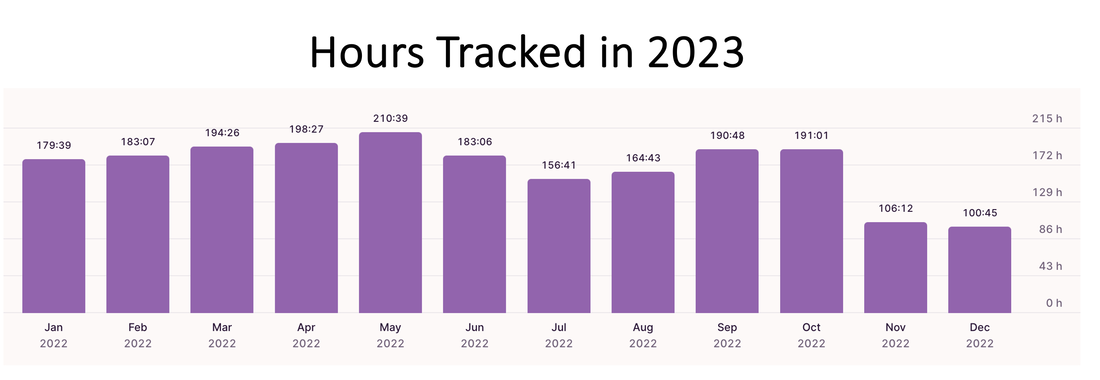
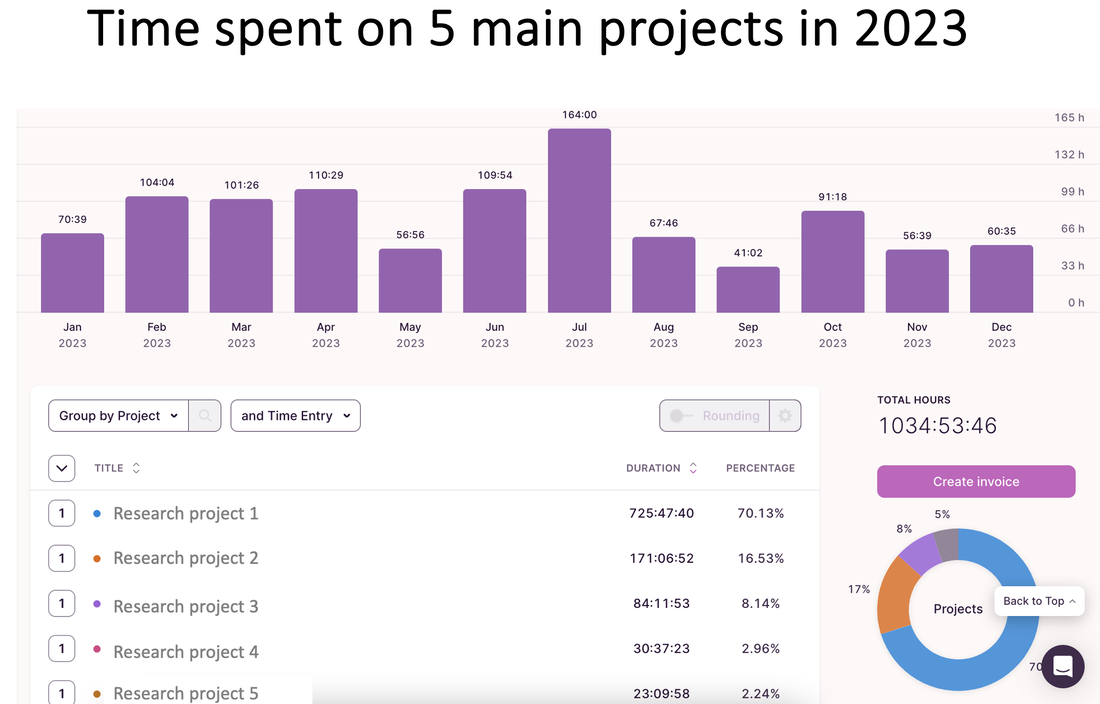
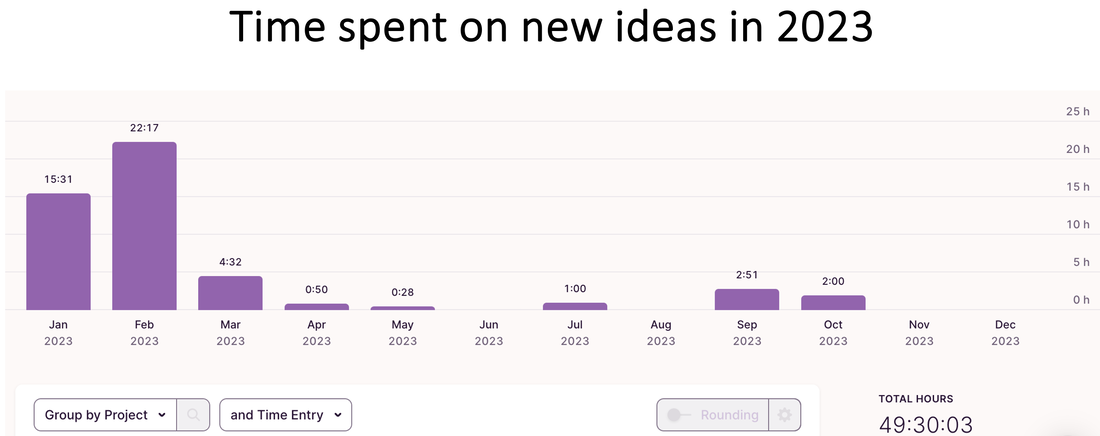
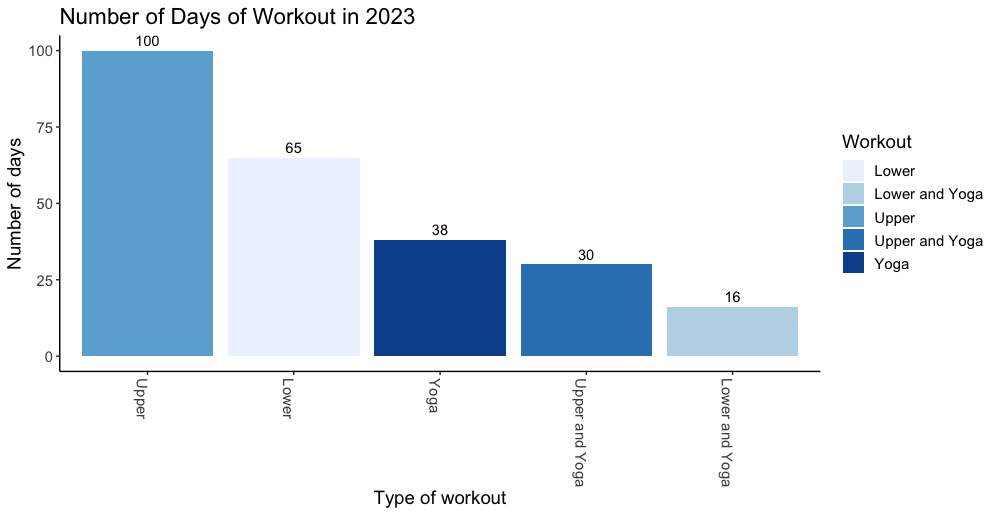
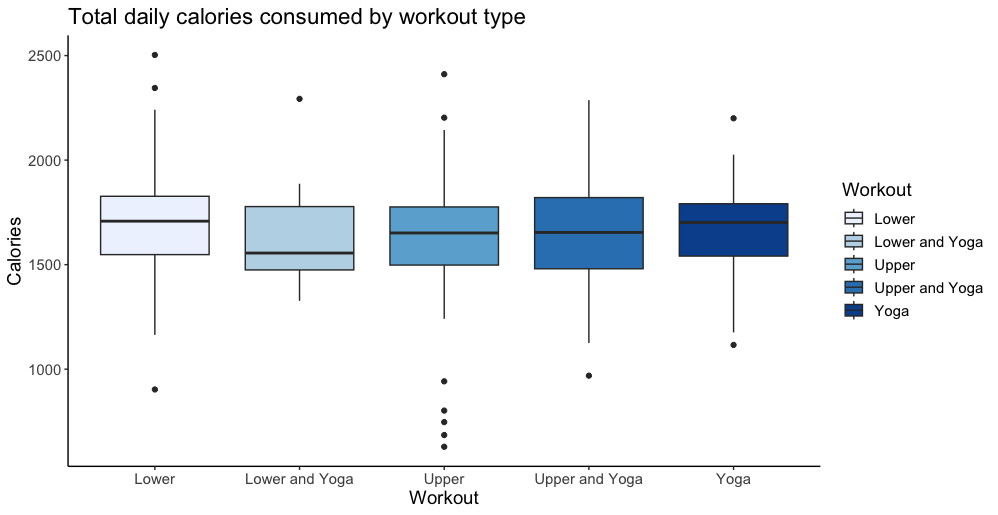
Bonus: One new interesting comparison I plotted this year was my actual calorie intake relative to the goals I set in the MyFitnessPal app (e.g., typical goals will be between 1600-2000 calories per day). I noticed that I was mostly eating below my goal (!!):
Picture
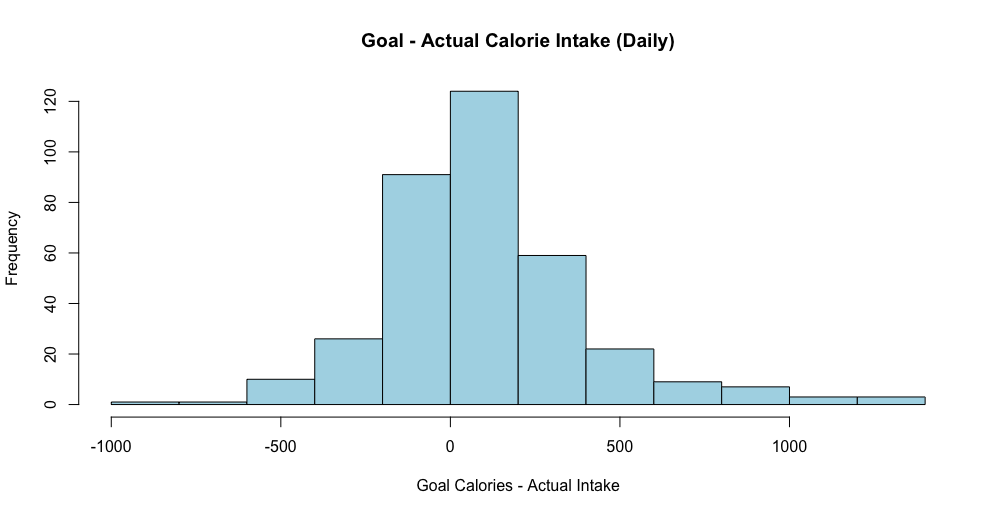
Note: These data are combined from various sources. The project hours data come from Toggl. The workouts data come from 3 different apps - Strong, Trainerize, and my Mindbody app I use to book yoga classes. The calorie data come from MyFitnessPal which I have been using to track my food for over 900 days. Other stuff I track but don't report is my reading lists on Goodreads (made it half way to my reading goal this year) and my Italian lessons on Duolingo (proud 250 days so far). 

--

If you find these posts useful, please let me know. Often, the work academics do can appear "black box" to others who can tend to feel that our only job is what we do in the classroom and that we get "summers off" (nice joke). So this is my attempt to share what we do in our job, which is more like an identity or a lifestyle rather than a job.

My plan for 2024? I might move to a more intuitive approach to health and work i.e., less tracking... But we will see. 
0 Comments

My interview with Poets&Quants [2023 Best Undergrad Professors]

12/4/2023

0 Comments

 
Picture
I knew I wanted to be a business school professor when… "I never wanted to be a professor. I found my way to this career – which is now truly my dream job – through many winding paths and serendipity."

Click here for the complete interview on Poets & Quants' website. 

0 Comments

Academic job market season (and phd advice!)

6/9/2023

0 Comments

 
It’s time for the academic job market season again. I have been helping our students practice their AMA conference-style 30-minute job interviews.

Here’s some thoughts and general advice I compiled in a Twitter thread recently:

  1. Use your time well. The goal is not to present every study and robustness check in this short interview format. Share the main narrative – and enough to spark interest in the topic and demonstrate the rigor and credibility of your findings.
  2. State explicitly who you are and why you study what you study using the methods you use, e.g., “I study mobile and digital marketing using causal inference and machine learning. I got interested in these topics even before my PhD when I had a retail and ecommerce startup.”
  3. Get to your job market paper (JMP) and research questions relatively early in the presentation. Shouldn’t take more than 1-2 slides to motivate. State your questions clearly.
  4. Use the same language and terminology throughout the talk. Keep a consistent narrative. Avoid jargon and surprises. A new term on slide 12 with key results will likely confuse the audience.
  5. Know who’s going to be in the audience (most departments tell you), have some idea about their work, and 1-2 specific questions you genuinely want to know about their group/department.
  6. Reiterate your pipeline and overall research program in addition to the one JMP you spend most of the time on. Also be prepared to talk about teaching – courses you’ve taught and any innovative highlights, e.g., a new technology you implemented.
  7. Follow up thank-you notes. I might be old-fashioned, but I still believe in these. No one is obligated to listen to your research; send an email to thank them individually for their attention and if possible, for the specific comments they gave you during the talk.

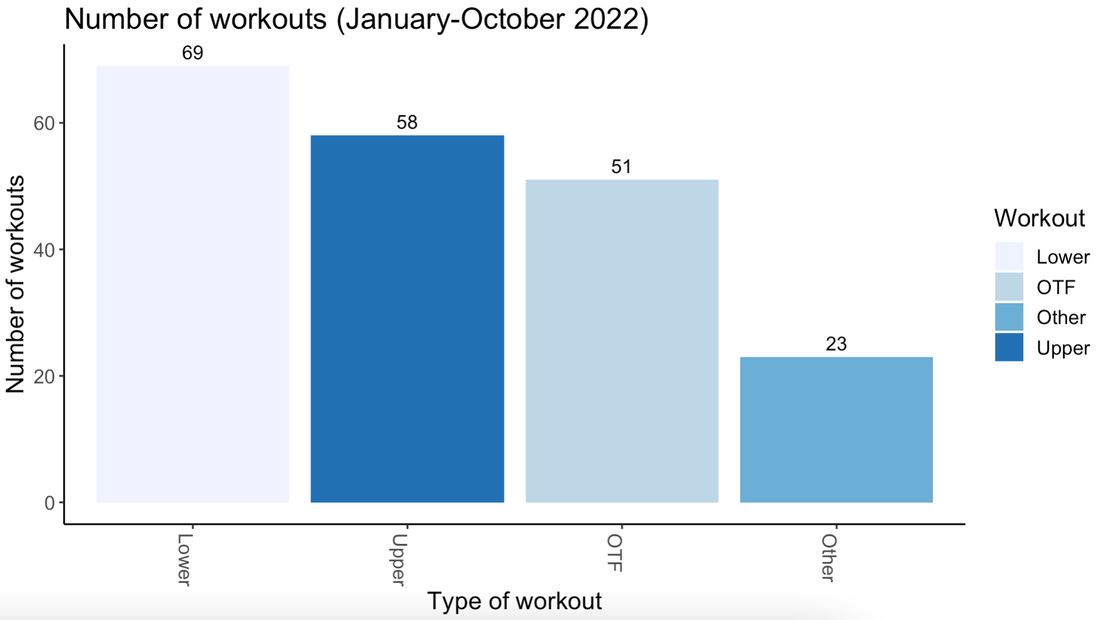
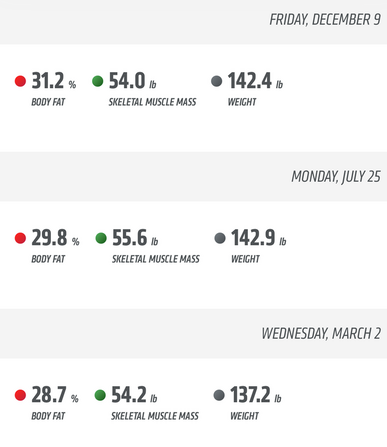
Most important, take care of yourself and be kind!
0 Comments

2022 – My year in numbers!

12/9/2022

0 Comments

 
 Last year, I started tracking my data and wrote a blog post about it.

I primarily track two types of data: Work (e.g., hours logged on research, teaching) and health (e.g., daily workouts, calories consumed, body measurements).
 
2021 stats: In 2021, I spent 932 hours working on my top 6 research projects. I completed over 250 hours of workouts and lost over 20 lbs with a 5% drop in body fat.
 
It’s a bit soon to summarize 2022 and the December data aren’t in yet – but I wanted to take an early look at the year (minus December).
 
2022 stats: In 2022, so far, I spent 818 hours working on my top 5 projects with an additional 59 hours exploring 7-8 new ideas of which only 2 have continued and stuck with me. Killed 5 new project ideas this year! Taught at least twice as many classes as 2021.

Of course, all this is based on the projects and hours I am able to track subject to some measurement error. Many "new ideas" never make it to this set. ​So these numbers should be interpreted as lower bounds. 
 
My key trends @ work:


  1. Expanding the pie: My total tracked hours of work in 2022 (minus December)  were 30% more (!!!) compared to 2021. I am amazed that I could continue putting in the hours towards research given that my work commitment to my teaching doubled in the 2022 calendar year; I taught 3 courses in the Spring (one carry-forward from 2021) and 2 in the Fall (with Spring 2023 off teaching) + a 4-week iMBA course!
  2. Exploitation-exploration trade-off: I spent more time on fewer research projects (still too many IMO). I also more actively used a “walk away” strategy; I was more deliberate about walking away from projects early on. I used two main criteria: Is this a project I want to work on for the next 3-5 years i.e., does it align with my research interests? Is this likely to be impactful i.e., does it have a clear contribution?
 
My key trends with fitness:

With fitness, my main goal this year was maintenance. I continued to keep the 20lbs I lost in 2021 off and maintained my 250 or so workouts with lots of long runs/cardio in the first half of the year and transitioning to mostly strength workouts in the second half. 
 
Overall – what a year it’s been!

​More details below for those who love to see the data as much as I do.


(1) Expanding the pie: 30% more hours in 2022

2022 vs. 2021 data!

Logged more hours in the summer this year compared with 2021. Thanks to Thanksgiving, the month of November in both years was pretty good for home/family time. 
Picture
Picture

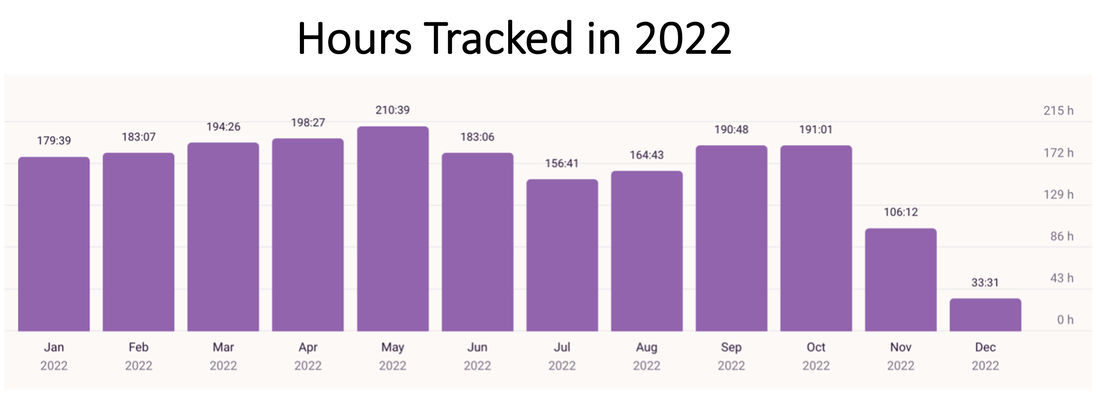
(2) Exploitation-exploration trade-off

Invested primarily in my 5 main projects in the early part of the year with over 60% time on just 2 of them. Both are now (re)submitted. Fingers crossed!
Picture
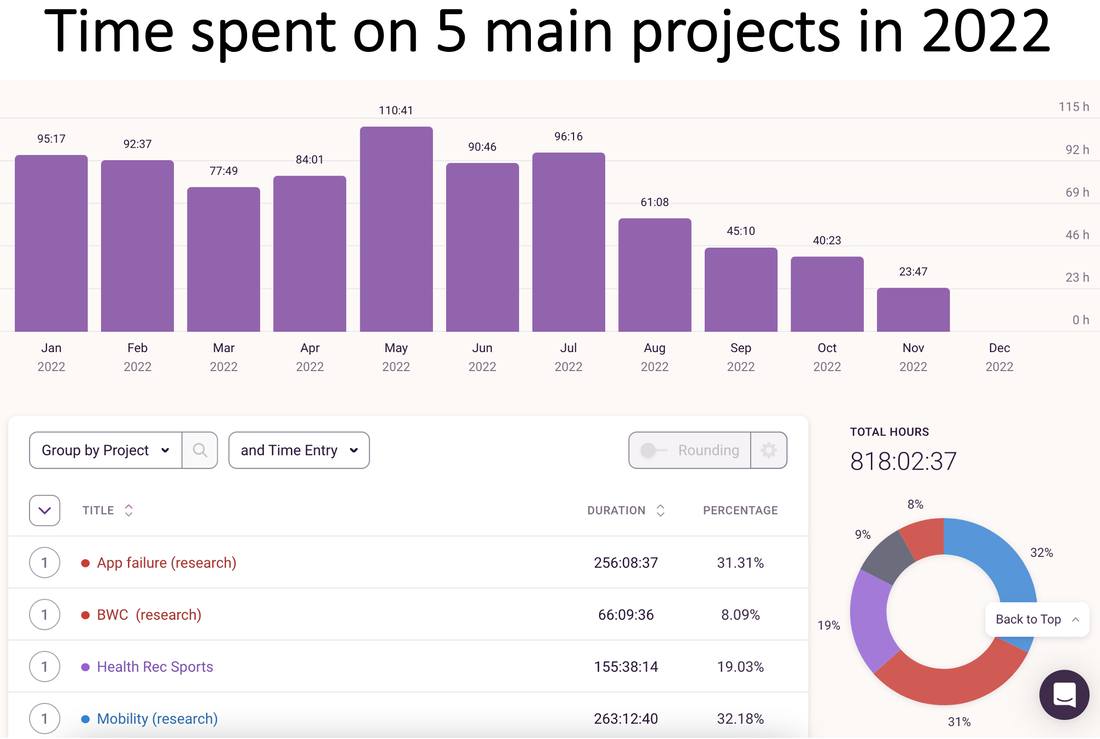
Tried out new ideas and teams more in the second half of the year. I am pretty sure I didn't track my time on these ideas properly but spent about 59 hours as a lower bound:
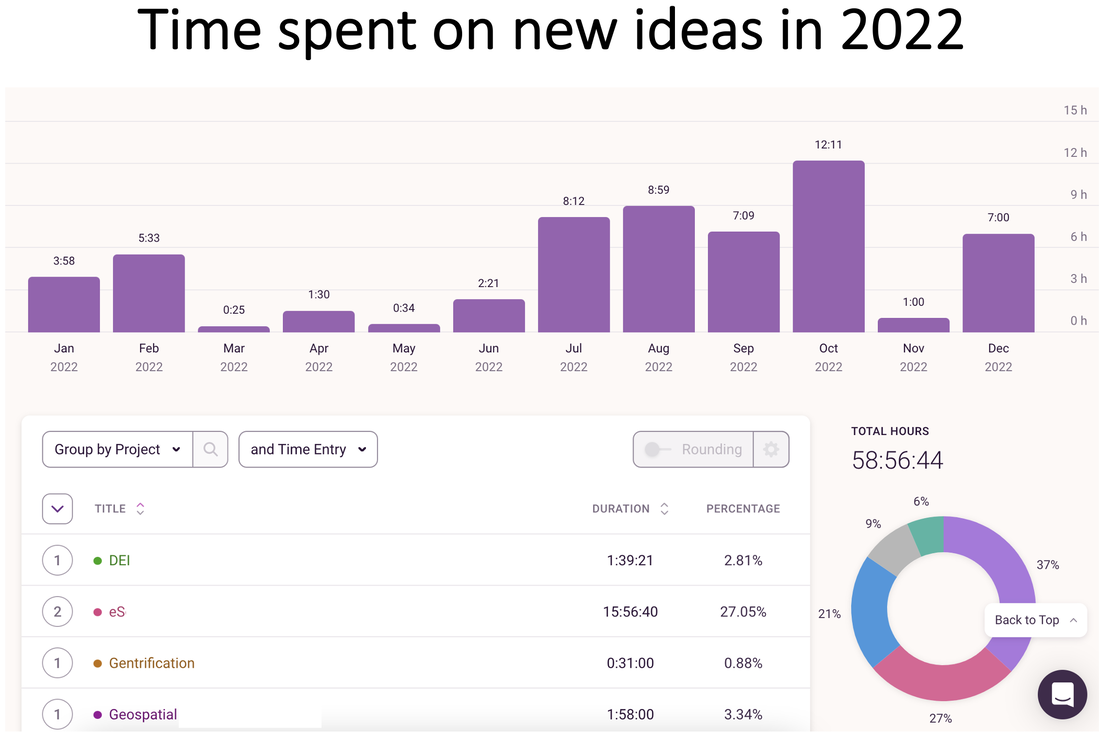
Picture

What's in a Number?
​Key “qualitative” milestones @ work this year

Hours worked is a limited measure; it mostly reflects the work that went in and my priorities. More hours do not always translate to more outcomes, but they do signal to me that I am enjoying the process and using my time well. The outcomes are always mixed -- and often beyond our control. This is a humbling realization. 

Research progress: For me, this year started with a major setback. I submitted a major revision in January that turned into a third round rejection for a paper I have spent at least 1,000+ hours since I started tracking in 2021 (and several more during my PhD). The summer was also challenging, as several projects moved slower that I'd have liked. However, the year is ending on a high note. The summer projects I did push forward are now submitted. I also received a conditional acceptance on a paper with a relatively large team, where I am not a lead author, but one that still feels great as a nice closure to years of teamwork! I also pushed forward a solo-authored paper this year, which is now a working draft (yay!) and no longer on the back-burner. Finally, I submitted my first ever NSF grant proposal as a co-PI with a team from education and computer science. 

Teaching highlights: I have been a proponent of MOOCs for a decade. This year, thanks to the Gies College, I was able to teach in the online space. I started teaching in our online iMBA program and also offer
 a MOOC version of marketing analytics. I filmed about 1-2 hours of content in the summer to introduce causal analysis in this course after I took it over from the previous instructor. Lots of additional changes and revamp is in the works. Excited to teach a course with over 17,000 learners. 

This year, I also took on an undergrad course on marketing strategy, in addition to my marketing analytics course for MS students. I love our undergrads. We had fun with the Markstrat simulation -- and it was as much a learning curve for me as it was for them! If you want to learn more about how you can use Markstrat, watch my "teaching webinar" on this link (starting at about 17:30 minutes).

Finally, my marketing analytics class that had once struggled with enrollments exceeded 50 students this fall!


Other stuff:
This was also the year of conferences for me. Since the pandemic subsided, I was excited to get back into the in-person conference mode. I gave invited talks at Wisconsin School of Business (twice this year!) and Cornell, and also attended conferences at Emory, Duke, Texas A&M, UChicago, and the University of Tennessee! All of this in addition to a few amazing weeks in the summer at the University of Toronto. Grateful to have a great community! 

I also presented my work widely within the Illinois community and presented my research at the Grainer College of Engineering, at the Center for Social and Behavioral Studies, and at the Gies 5th anniversary celebration. 

Workout summaries!

When I am not working, you can pretty much always find me at the gym. I stayed consistent this year with my 5-6 am workouts.

​I completed at least 200 workouts in Jan-Oct 2022. I started the year focusing on running -- and was able to get to 9 miles on the treadmill before I terribly injured my foot and had to go into physical therapy. I transitioned to other types of workouts in the second half of the year, including spinning/cycle classes and yoga. I kept up with OTF (i.e., Orange theory) for the community aspect, but plan to discontinue to focus more on my upper-lower splits. 
Picture
I was also consistent with tracking my food. This was particularly challenging during my travels, but I recently hit a "550 days of food logging" milestone so I plan to stick to it. My calorie goals through the year varied between 1600-2000 calories depending on my goals in different phases. I did't see much difference based on my calorie consumption on different workout days this year either. 
Picture
Picture
I started with a maintenance goal for my body composition and ended this year close to where I started! This is a big win given my running injury in March, getting COVID in June, and traveling non-stop for conferences. I hope I can ramp up my fitness goals and balance work-life a bit better next year. Sometimes, less is more!

Last year, I got suggestions to track sleep and heart rate. With my Apple watch, this is much easier now. It tells me I sleep around 7 hours and have a resting heart rate of 50 bpm. Should have more data on this next year. 
What kind of data do you track? 

How I collected these data
 
Research project data: I use a mobile/web tool called Toggl that allows me to set up various buckets of projects I work on. All I have to do is hit play when I begin working on a project and pause when I stop. Most of the times, I do remember to track it. If I forget to stop it, Toggl sends me an timely email nudge to go in and pause it, so I guess with some accuracy what time I stopped working. For the most part, I can correctly see where my time is going with some margin of error, of course.
 
Fitness data: I use a combination of apps to track my fitness journey, including MyFitnessPal for nutrition, the Orangetheory app and heart rate monitor for OTF workouts, and my own filming skills (iphone camera, really) to keep track of non-OTF strength workouts.
0 Comments

Awarded the Emerging Scholar honor by the Retail & Pricing SIG at the summer ama, 2022

8/22/2022

0 Comments

 
Picture
0 Comments
<<Previous

    DISCOVER

    Exciting marketing research, cutting-edge methods, and highlights from marketing conferences

    Categories

    All
    Event Highlights
    Machine Learning
    Media Mentions
    PhD Resources
    Research
    R Programming
    Teaching

    Archives

    January 2025
    May 2024
    February 2024
    January 2024
    December 2023
    June 2023
    December 2022
    August 2022
    June 2022
    December 2021
    June 2021
    January 2021
    November 2020
    September 2020
    August 2020
    June 2020
    May 2020
    August 2019
    January 2019
    June 2018
    April 2018
    February 2018
    December 2017
    October 2017
    August 2017

Powered by Create your own unique website with customizable templates.
  • Home
  • Research
  • CV
  • Blog
  • Videos
  • Contact
  • Personal