|
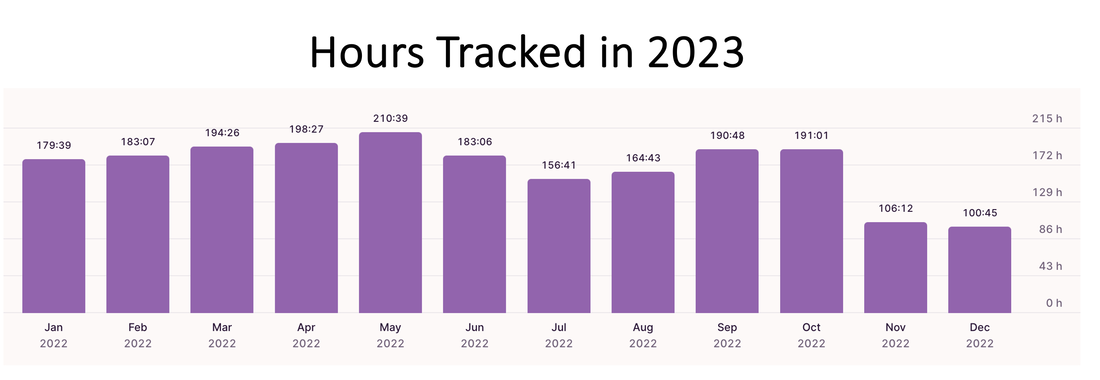
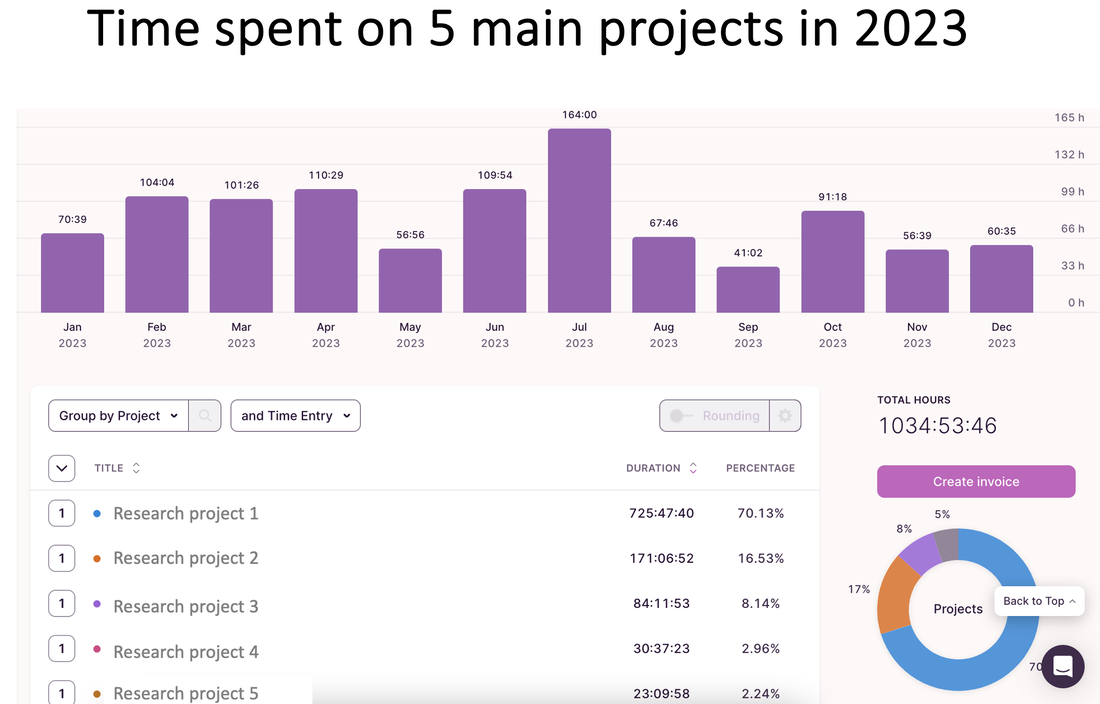
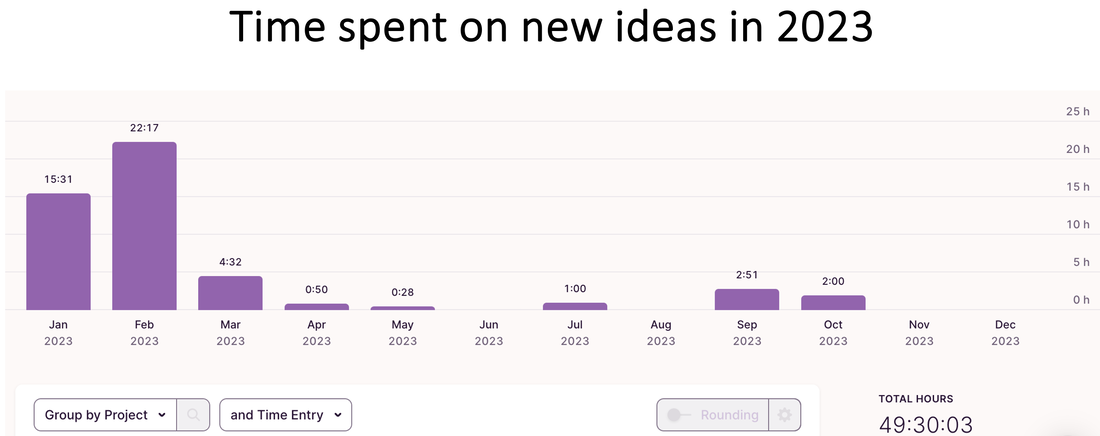
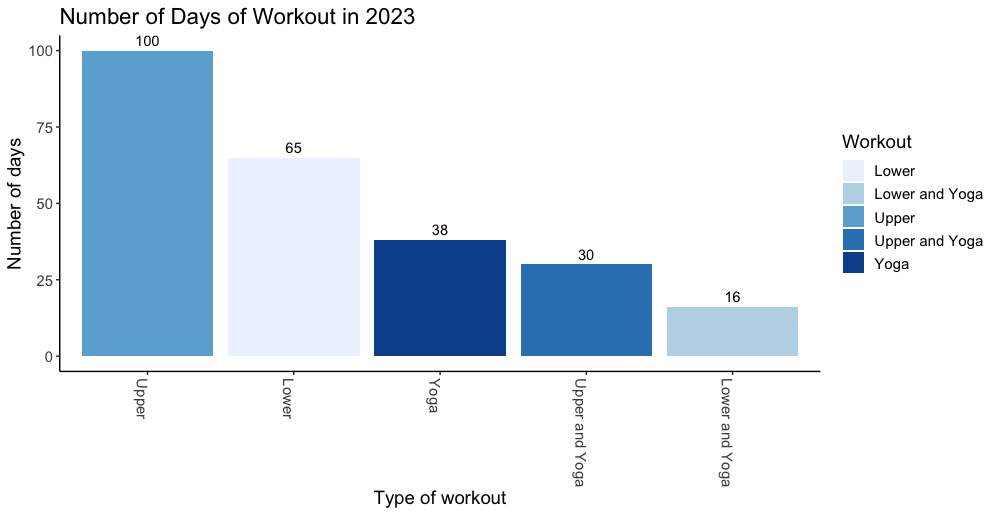
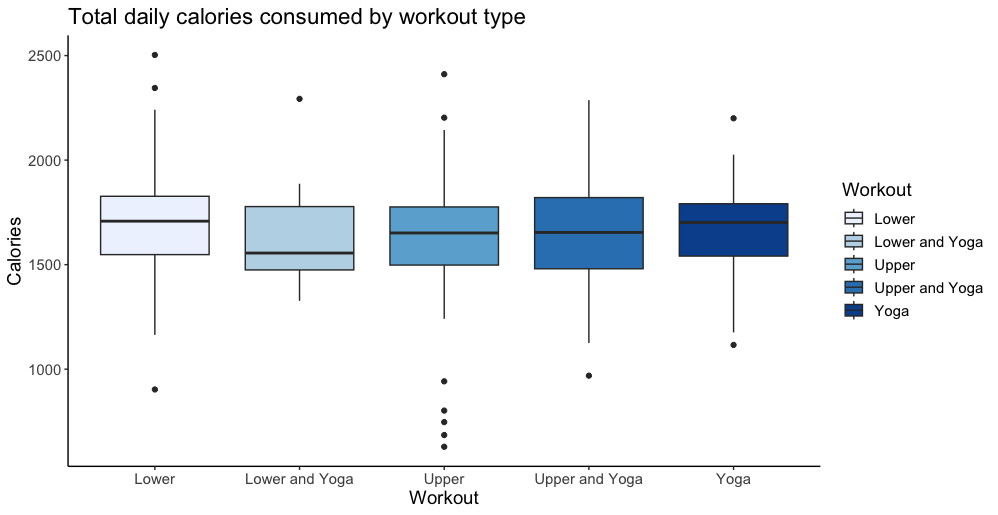
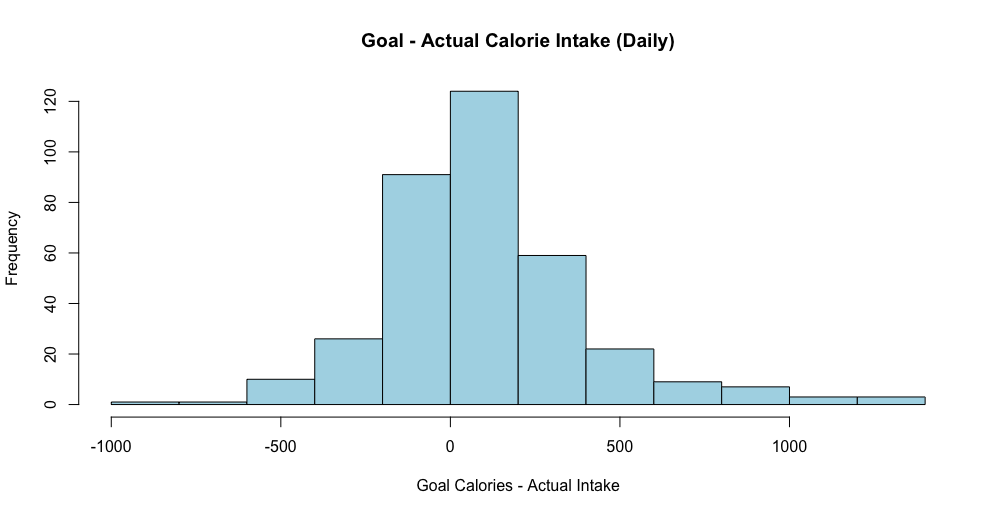
For the last two years, I have been tracking and sharing my data in these blog posts for 2022 and 2021. This year, I continued the tradition. I primarily track two types of data: Work (e.g., hours logged on research, reviewing, teaching) and health (e.g., daily workouts, calories consumed). Recap: In both 2021 and 2022, I spent ~900 hours working on my top 5-6 research projects based on reports generated by an app called Toggl. Of course, all this is based on the projects and hours I am able to track in Toggl subject to some measurement error. I completed over 250 hours of workouts each year, dropping 20+ lbs in 2021 then maintaining in 2022. How does 2023 look? @ work: This year, I exceeded my research input of the last two years. I submitted 6 new/revised submissions (relative to 4ish last two years), including a manuscript with a PhD student and a solo-authored paper. I spent 1,000+ hours on my top 4 projects with over 70% of that on one paper (phew!). I spent fewer hours on exploring new ideas than I have in the past -- mostly doing so in the Spring semester (no teaching). Unlike last few years, when I had to kill many new ideas, I was able to see this one through -- and moved it into a "real" project bucket to become my 2nd biggest project investment this year. Importantly, I noticed that my hours spent on reviewing/writing referee reports doubled compared to last year. That must be a good thing, right? I don't usually report this but will be fun to track over the long-term.... @ the gym: I increased my focus on weightlifting and was able to achieve new PRs of 200 and 300 lbs on squats and hip thrusts in June (!!) despite several health challenges throughout the year. I incorporated more yoga (although steady state cardio and HIIT both took a hit this year for me). Yoga has been a lovely addition to my life -- and I will not attempt to capture its impact in numbers. -- As always, quality over quantity; so I cannot end this post without mentioning some of the opportunities for growth this year that are not captured by the data. Many in-depth conversations with peers and colleagues, opportunities to visit other groups (Reichman and Tel Aviv University in Israel, Washington University in St. Louis, Michigan Ross, and INSEAD in France as well as conferences @ UT-Dallas and Temple), and to continue to push past many rejections and risky revisions. Other highlights of the year include my interactions with students, co-chairing our PhD committee, organizing mental health workshops for students, and being part of their convocation experience esp. for the iMBA graduates. -- More stats and how I track my data below: Bonus: One new interesting comparison I plotted this year was my actual calorie intake relative to the goals I set in the MyFitnessPal app (e.g., typical goals will be between 1600-2000 calories per day). I noticed that I was mostly eating below my goal (!!): Note: These data are combined from various sources. The project hours data come from Toggl. The workouts data come from 3 different apps - Strong, Trainerize, and my Mindbody app I use to book yoga classes. The calorie data come from MyFitnessPal which I have been using to track my food for over 900 days. Other stuff I track but don't report is my reading lists on Goodreads (made it half way to my reading goal this year) and my Italian lessons on Duolingo (proud 250 days so far).
-- If you find these posts useful, please let me know. Often, the work academics do can appear "black box" to others who can tend to feel that our only job is what we do in the classroom and that we get "summers off" (nice joke). So this is my attempt to share what we do in our job, which is more like an identity or a lifestyle rather than a job. My plan for 2024? I might move to a more intuitive approach to health and work i.e., less tracking... But we will see.
0 Comments
Leave a Reply. |
DISCOVERExciting marketing research, cutting-edge methods, and highlights from marketing conferences Categories
All
Archives
May 2024
|
