UNNATI N.
  • Home
  • Research
  • CV
  • Blog
  • Videos
  • Contact
  • Personal

Let's Learn Together

Data-driven Marketing for Theory and Practice

2022 – My year in numbers!

12/9/2022

0 Comments

 
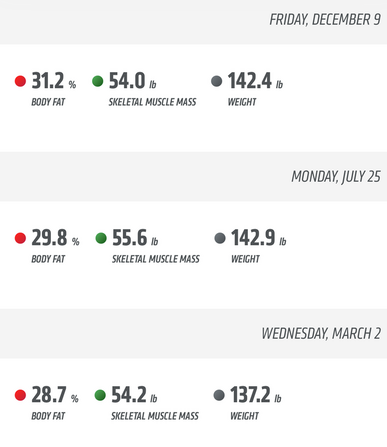
 Last year, I started tracking my data and wrote a blog post about it.

I primarily track two types of data: Work (e.g., hours logged on research, teaching) and health (e.g., daily workouts, calories consumed, body measurements).
 
2021 stats: In 2021, I spent 932 hours working on my top 6 research projects. I completed over 250 hours of workouts and lost over 20 lbs with a 5% drop in body fat.
 
It’s a bit soon to summarize 2022 and the December data aren’t in yet – but I wanted to take an early look at the year (minus December).
 
2022 stats: In 2022, so far, I spent 818 hours working on my top 5 projects with an additional 59 hours exploring 7-8 new ideas of which only 2 have continued and stuck with me. Killed 5 new project ideas this year! Taught at least twice as many classes as 2021.

Of course, all this is based on the projects and hours I am able to track subject to some measurement error. Many "new ideas" never make it to this set. ​So these numbers should be interpreted as lower bounds. 
 
My key trends @ work:


  1. Expanding the pie: My total tracked hours of work in 2022 (minus December)  were 30% more (!!!) compared to 2021. I am amazed that I could continue putting in the hours towards research given that my work commitment to my teaching doubled in the 2022 calendar year; I taught 3 courses in the Spring (one carry-forward from 2021) and 2 in the Fall (with Spring 2023 off teaching) + a 4-week iMBA course!
  2. Exploitation-exploration trade-off: I spent more time on fewer research projects (still too many IMO). I also more actively used a “walk away” strategy; I was more deliberate about walking away from projects early on. I used two main criteria: Is this a project I want to work on for the next 3-5 years i.e., does it align with my research interests? Is this likely to be impactful i.e., does it have a clear contribution?
 
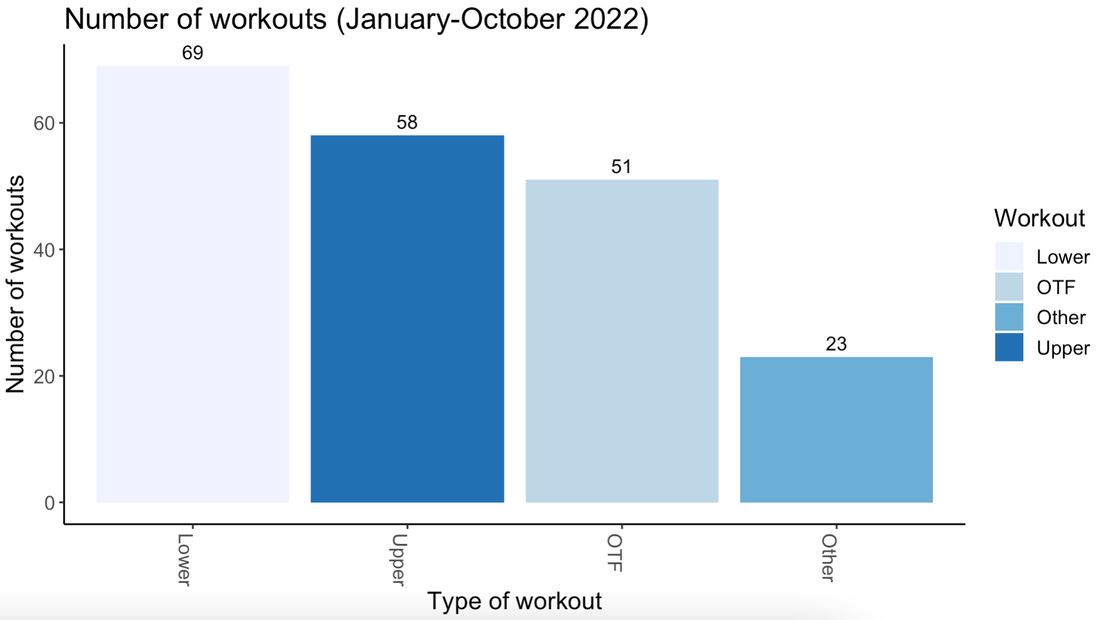
My key trends with fitness:

With fitness, my main goal this year was maintenance. I continued to keep the 20lbs I lost in 2021 off and maintained my 250 or so workouts with lots of long runs/cardio in the first half of the year and transitioning to mostly strength workouts in the second half. 
 
Overall – what a year it’s been!

​More details below for those who love to see the data as much as I do.


(1) Expanding the pie: 30% more hours in 2022

2022 vs. 2021 data!

Logged more hours in the summer this year compared with 2021. Thanks to Thanksgiving, the month of November in both years was pretty good for home/family time. 
Picture
Picture

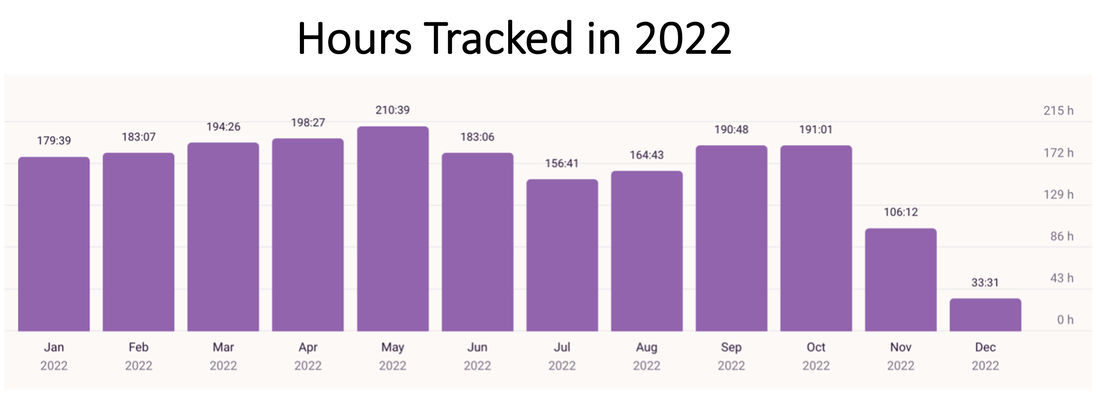
(2) Exploitation-exploration trade-off

Invested primarily in my 5 main projects in the early part of the year with over 60% time on just 2 of them. Both are now (re)submitted. Fingers crossed!
Picture
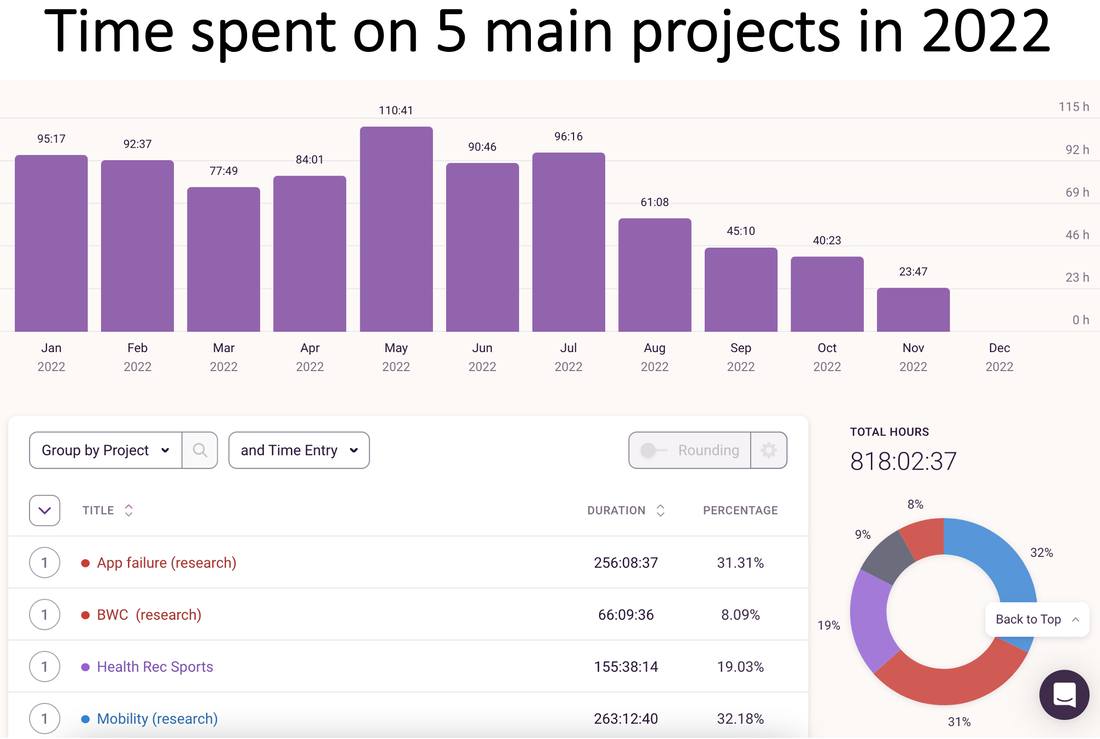
Tried out new ideas and teams more in the second half of the year. I am pretty sure I didn't track my time on these ideas properly but spent about 59 hours as a lower bound:
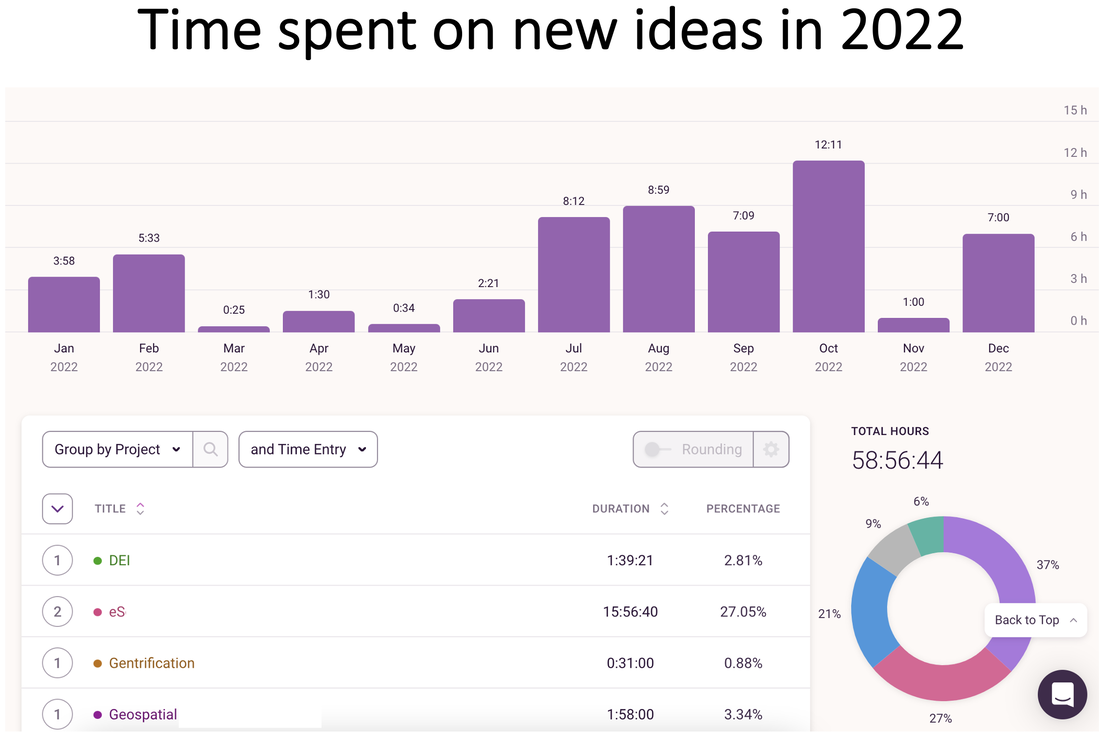
Picture

What's in a Number?
​Key “qualitative” milestones @ work this year

Hours worked is a limited measure; it mostly reflects the work that went in and my priorities. More hours do not always translate to more outcomes, but they do signal to me that I am enjoying the process and using my time well. The outcomes are always mixed -- and often beyond our control. This is a humbling realization. 

Research progress: For me, this year started with a major setback. I submitted a major revision in January that turned into a third round rejection for a paper I have spent at least 1,000+ hours since I started tracking in 2021 (and several more during my PhD). The summer was also challenging, as several projects moved slower that I'd have liked. However, the year is ending on a high note. The summer projects I did push forward are now submitted. I also received a conditional acceptance on a paper with a relatively large team, where I am not a lead author, but one that still feels great as a nice closure to years of teamwork! I also pushed forward a solo-authored paper this year, which is now a working draft (yay!) and no longer on the back-burner. Finally, I submitted my first ever NSF grant proposal as a co-PI with a team from education and computer science. 

Teaching highlights: I have been a proponent of MOOCs for a decade. This year, thanks to the Gies College, I was able to teach in the online space. I started teaching in our online iMBA program and also offer
 a MOOC version of marketing analytics. I filmed about 1-2 hours of content in the summer to introduce causal analysis in this course after I took it over from the previous instructor. Lots of additional changes and revamp is in the works. Excited to teach a course with over 17,000 learners. 

This year, I also took on an undergrad course on marketing strategy, in addition to my marketing analytics course for MS students. I love our undergrads. We had fun with the Markstrat simulation -- and it was as much a learning curve for me as it was for them! If you want to learn more about how you can use Markstrat, watch my "teaching webinar" on this link (starting at about 17:30 minutes).

Finally, my marketing analytics class that had once struggled with enrollments exceeded 50 students this fall!


Other stuff:
This was also the year of conferences for me. Since the pandemic subsided, I was excited to get back into the in-person conference mode. I gave invited talks at Wisconsin School of Business (twice this year!) and Cornell, and also attended conferences at Emory, Duke, Texas A&M, UChicago, and the University of Tennessee! All of this in addition to a few amazing weeks in the summer at the University of Toronto. Grateful to have a great community! 

I also presented my work widely within the Illinois community and presented my research at the Grainer College of Engineering, at the Center for Social and Behavioral Studies, and at the Gies 5th anniversary celebration. 

Workout summaries!

When I am not working, you can pretty much always find me at the gym. I stayed consistent this year with my 5-6 am workouts.

​I completed at least 200 workouts in Jan-Oct 2022. I started the year focusing on running -- and was able to get to 9 miles on the treadmill before I terribly injured my foot and had to go into physical therapy. I transitioned to other types of workouts in the second half of the year, including spinning/cycle classes and yoga. I kept up with OTF (i.e., Orange theory) for the community aspect, but plan to discontinue to focus more on my upper-lower splits. 
Picture
I was also consistent with tracking my food. This was particularly challenging during my travels, but I recently hit a "550 days of food logging" milestone so I plan to stick to it. My calorie goals through the year varied between 1600-2000 calories depending on my goals in different phases. I did't see much difference based on my calorie consumption on different workout days this year either. 
Picture
Picture
I started with a maintenance goal for my body composition and ended this year close to where I started! This is a big win given my running injury in March, getting COVID in June, and traveling non-stop for conferences. I hope I can ramp up my fitness goals and balance work-life a bit better next year. Sometimes, less is more!

Last year, I got suggestions to track sleep and heart rate. With my Apple watch, this is much easier now. It tells me I sleep around 7 hours and have a resting heart rate of 50 bpm. Should have more data on this next year. 
What kind of data do you track? 

How I collected these data
 
Research project data: I use a mobile/web tool called Toggl that allows me to set up various buckets of projects I work on. All I have to do is hit play when I begin working on a project and pause when I stop. Most of the times, I do remember to track it. If I forget to stop it, Toggl sends me an timely email nudge to go in and pause it, so I guess with some accuracy what time I stopped working. For the most part, I can correctly see where my time is going with some margin of error, of course.
 
Fitness data: I use a combination of apps to track my fitness journey, including MyFitnessPal for nutrition, the Orangetheory app and heart rate monitor for OTF workouts, and my own filming skills (iphone camera, really) to keep track of non-OTF strength workouts.
0 Comments


Leave a Reply.

    DISCOVER

    Exciting marketing research, cutting-edge methods, and highlights from marketing conferences

    Categories

    All
    Event Highlights
    Machine Learning
    Media Mentions
    PhD Resources
    Research
    R Programming
    Teaching

    Archives

    January 2025
    May 2024
    February 2024
    January 2024
    December 2023
    June 2023
    December 2022
    August 2022
    June 2022
    December 2021
    June 2021
    January 2021
    November 2020
    September 2020
    August 2020
    June 2020
    May 2020
    August 2019
    January 2019
    June 2018
    April 2018
    February 2018
    December 2017
    October 2017
    August 2017

Powered by Create your own unique website with customizable templates.
  • Home
  • Research
  • CV
  • Blog
  • Videos
  • Contact
  • Personal