|
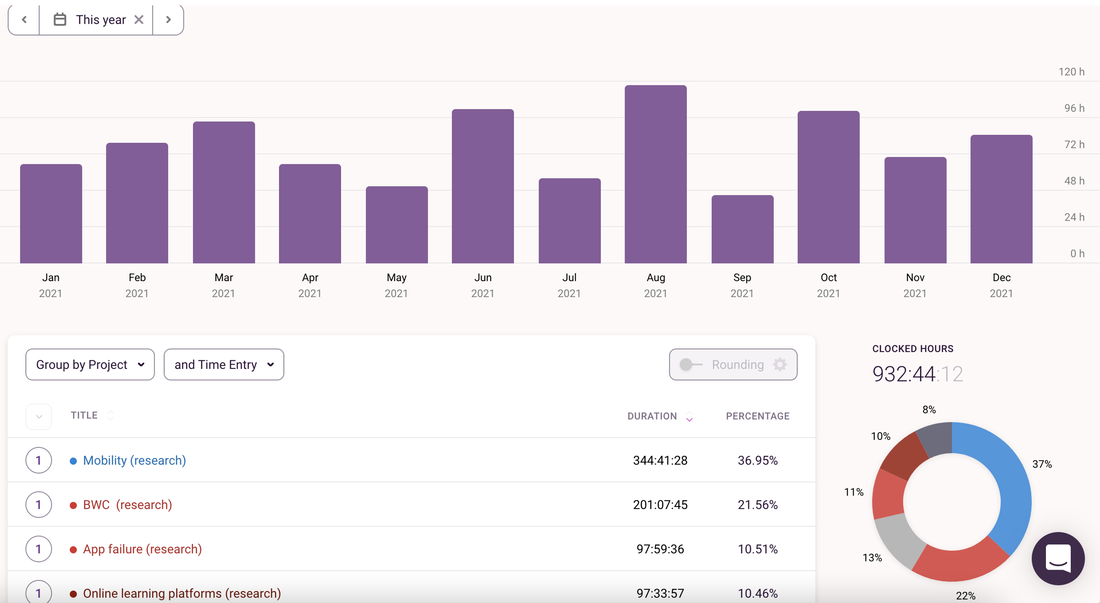
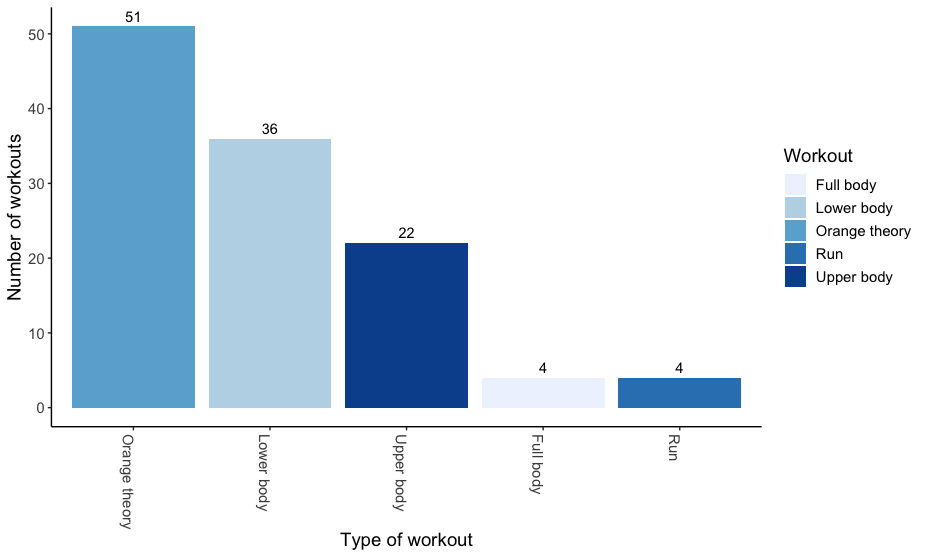
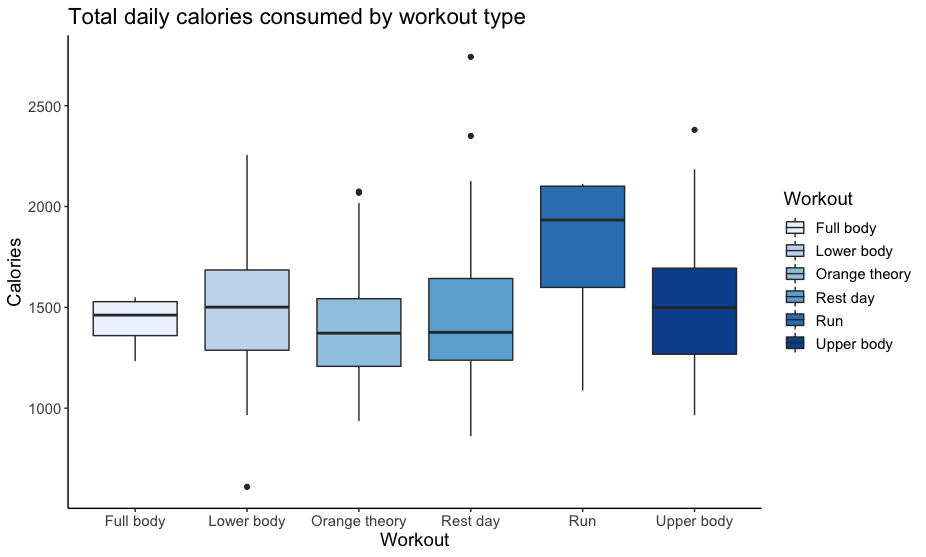
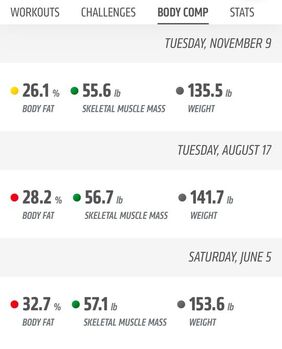
Where did 2021 go? I know exactly where. If you know me or anything about me, you know that I love data. I track my workouts. I track my daily calorie intake and macros, and most importantly, I track the time I spend on various research projects. As 2021 comes to an end, I wanted to share some of the tracked data from my life. My hope is that this will be a useful sneak peek for current and future tenure-track assistant professors. Perhaps this may even be useful for those wanting to pursuing a goal in 2022, especially a fitness-related goal. Snapshot of what I did this year My biggest commitment in 2021 was my research projects. I spent 932 hours on my top 6 research projects this year! While I explored opportunities for new projects, it turned out that I spent 60% of my time on projects that continued from last year. Last year, in July-December 2020, I had already spent 610 hours advancing 3 of the top 6 research projects this year in terms of time commitment. In 2021, one of these continuing projects on online learning platforms was accepted for publication at the Journal of Marketing Research. Two were rejected in advanced rounds, and subsequently received an opportunity to revise at other journals (note to self: never give up). Interestingly, the research that I spent most time on took up about 37% of my effort this year. It has recently resulted in its first complete draft (coming soon). It also happens to be a paper about the privacy implications of tracking granular mobility data. Now onto the tracked data from my other big commitment of 2021 -- health and fitness. I completed over 250 hours of workouts this year! My breakdown from the last 6 months shows that I spent 117 hours spent working out between July-December. Of these, more than 50 hours were at Orangetheory fitness, a popular group fitness class comprising treadmill, rowing and strength training intervals. In addition, I spent about 58 hours doing heavier weightlifting, with 60% lower body training. I have been going to group fitness classes for more than 10 years but this year, for the first time, I stepped under the barbell, going from body weight squats to over 160lbs barbell back squats in just a few months. Since I also track my calorie consumption, what surprised me most was that I wasn’t eating any differently on my cardio vs. strength days, or upper vs. lower body days. The box plot below shows that I consumed very similar amount of total calories irrespective of the kind of workout I had that day. I'm curious to see how this split varies by macros, since I do make an effort to consume more carbs on lower body/heavier lifting days and keep carbs low on other days. Results? Overall, it was quite rewarding to see that I started this year at 160lbs and closed it just under 140lbs with a 7% drop in body fat (between June and November). Did tracking everything cause me to be more productive or get more in shape? I’ll leave that question for a future paper once I can figure out an identification strategy. For now, enjoying the descriptives and looking forward to continuing the tracking trajectory in 2022!
How I collected these data Time spent on research projects: I use a mobile/web tool called Toggl that allows me to set up various categories of projects I work on. All I have to do is hit play when I begin working on a project and pause when I stop. Most of the times, I do remember to track it. If I forget to stop it, Toggl sends me a timely email nudge to go in and pause it, so I guess with some accuracy what time I stopped working. For the most part, I can correctly see where my time is going with some margin of error, of course. Fitness data: I use a combination of apps to track my fitness journey, including MyFitnessPal for nutrition, the Orangetheory app and heart rate monitor for OTF workouts, and my own filming skills (iphone camera, really) to keep track of non-OTF strength workouts. |
DISCOVERExciting marketing research, cutting-edge methods, and highlights from marketing conferences Categories
All
Archives
May 2024
|


